

Share this
by Alberto Nantiat on June 14, 2022
We’re excited to announce the launch of a highly requested feature: Viewer insights.
Anyone can now get analytics of viewers watching their live stream. Curious to see when viewers have joined or left during your live stream? Do you want to know where your viewers are located, what the latency is, and which platform or browser they are using?
This new feature lets you keep an eye on some of the most relevant data coming from your event audience.
All you need is:
- An THEOlive account (if you’d not have an account yet, you can sign up here).
- An THEOlive channel. This guide explains how to get started.
Getting started with viewer insights
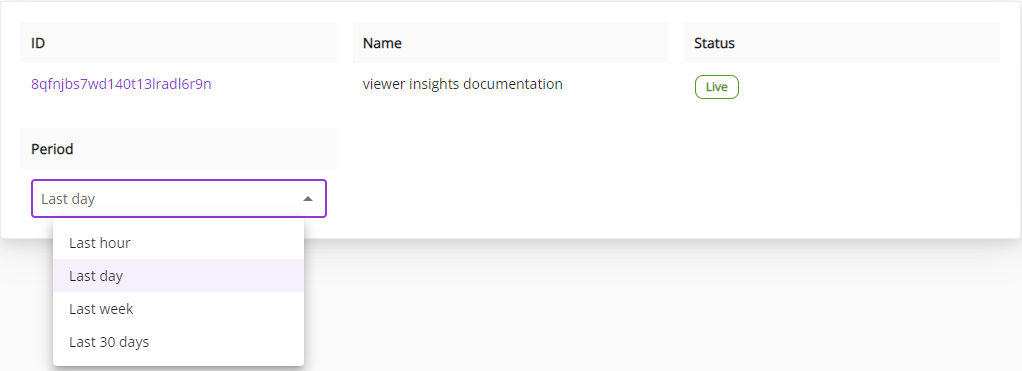
Viewer insights are available per channel and are directly accessible in the Details section of the channel view. When your channel has been configured and started, click on viewer insights, to access the dashboard.
In the dashboard, you can select the period for the viewer insights graphs. You can monitor your ongoing live event (data are updated every minute) or look back up to 30 days.
Analyzing viewer insights
The dashboard includes the following viewer insights:
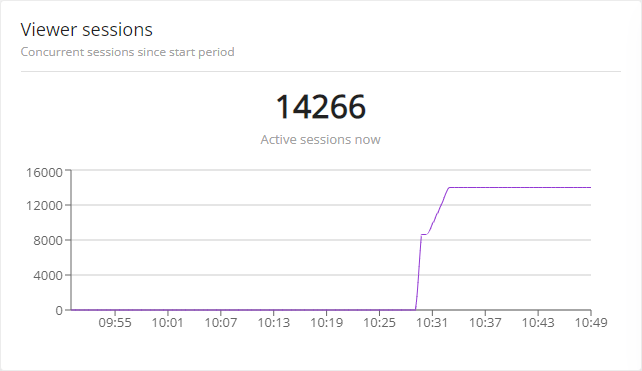
1. Number of concurrent viewers watching your live stream
This graph shows how many concurrent viewer sessions are active within the selected period. In addition, it also shows the active session right now, so that you know at any moment in time how many viewers are watching your live stream.
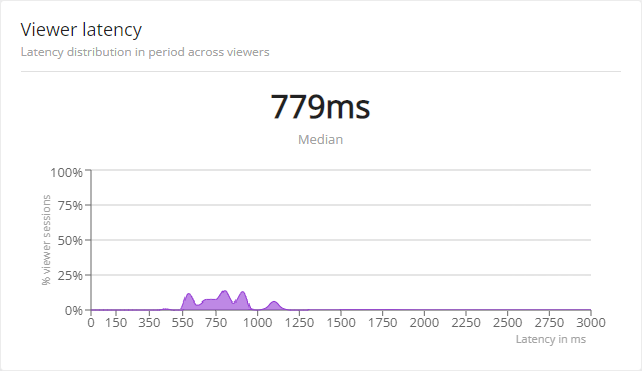
2. Latency experienced by your viewers
When interactivity is key, you want to make sure that you're live streaming at ultra-low latency. The next graph shows the latency your viewers are experiencing for the selected period. This is defined as the percentage of viewers who experienced a specific (median) latency.
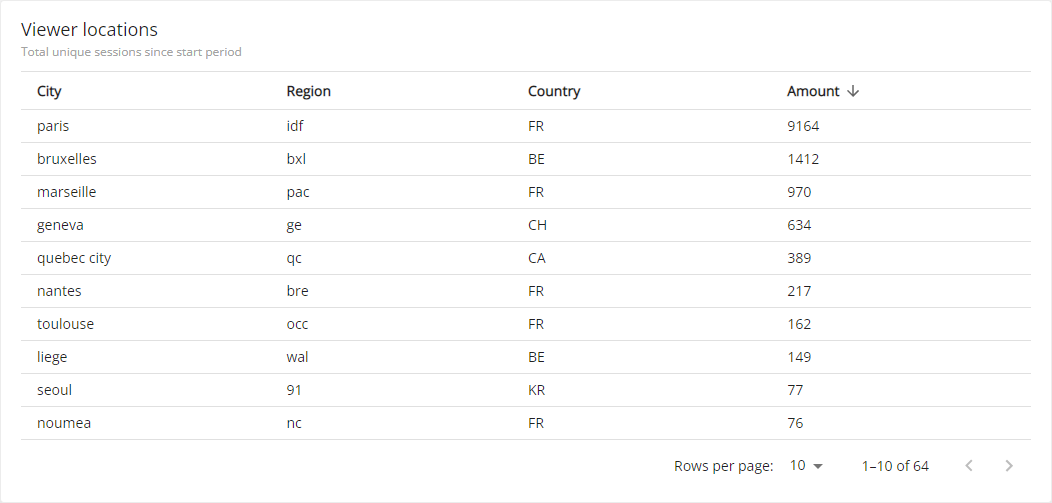
3. Where your viewers are located
This table shows where viewers are connecting from, and how many connections are established for each reported city/place.
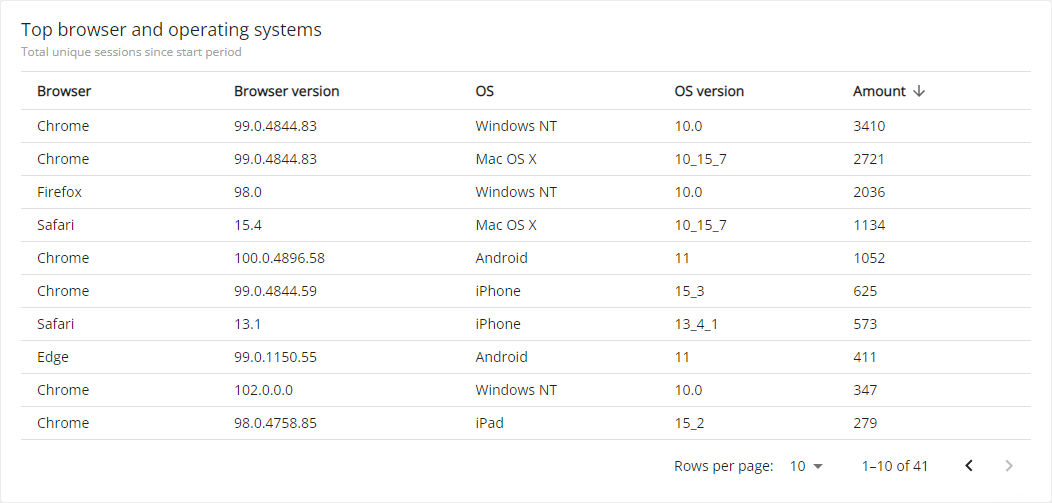
4. Platforms & browsers used by your viewers
Are your viewers using mobile phons or do they typically use a desktop? Or another platform? And which operating system are they using? These are just a few of the things you can find in the last table of the viewer insights dashboard.
The viewer count is reported by browser, browser version, operating system and operating system version.
This viewer insights feature is only the beginning so stay tuned!
Do you have a question about viewer insights? Contact us!